Management summary
Introduction
The Netherlands faces a housing crisis characterized by a lack of availability and affordability. Effective policy making requires active monitoring and accurate forecasting of the Dutch housing market. Kadaster aims to enhance their insights into the Dutch housing market by exploring advanced predictive models for localized forecasting. Traditional statistical models like ARIMA have shown limited success at the municipal scale, while deep learning (DL) techniques, particularly Long Short-Term Memory (LSTM) neural networks, have demonstrated better performance by capturing non-linear dynamics. Recent internal research by Kadaster indicated that property-related features improve forecasting accuracy more than economic features.
To further refine forecasting accuracy, this research incorporates spatial effects such as spatial autocorrelation and spillover effects, which are significant in the housing market. Recent advancements in Graph Neural Networks (GNNs) offer promising capabilities for multivariate timeseries forecasting by explicitly modeling spatial and temporal relationships. This research aims to leverage these spatial perspectives to improve Kadaster’s forecasting techniques at regional scales, ultimately contributing to more informed decision making.
Methodology
The methodology for this research involved several key steps. The OV03, as the primary dataset, covering Dutch private house transactions from January 1993 through March 2024, was supplemented with geographic data to map house transactions to municipalities, COROP areas, and provinces. Data preprocessing reduced the dataset to five essential columns: transaction date, transaction price, and geographic codes. Exploratory analysis revealed significant trends, such as the impact of the 2008 financial crisis and the COVID-19 pandemic on transaction volumes and prices. Python and its associated packages, along with Azure Databricks, were used for data handling, visualization, and model implementation.
Initially, a spatial autocorrelation test was conducted at three spatial scales (provincial, COROP, and municipal) for each month in the timeseries to determine the strength of spatial dependencies between the areas. Based on the results, the COROP scale was chosen for further analysis due to its optimal balance between scalability and spatial dependencies. A Granger causality test was then performed to identify market-leading and market-lagging areas, enhancing the understanding of housing market dynamics and potentially improving the forecasting models. Three types of DL forecasting models were employed: Baseline LSTMs, Single-Output LSTMs, and an MTGNN model that is capable of making forecasts for all regions simultaneously. The Baseline LSTMs served as benchmarks, while the Single-Output LSTMs and MTGNN leveraged spatial relationships to improve forecasting accuracy. All models produced a 12-month forecast for house prices and transaction volumes in the 40 COROP areas of the Netherlands, with performance evaluated using MAE, MAPE, and RMSE metrics.
Results
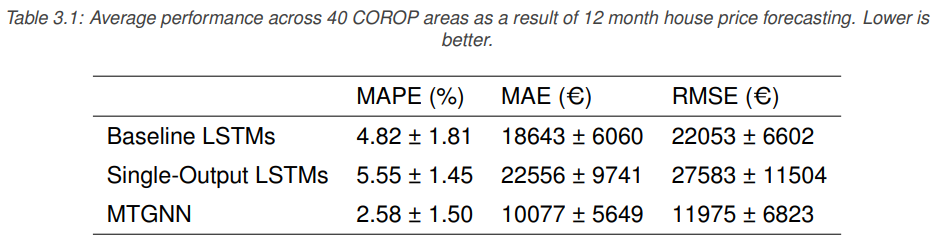
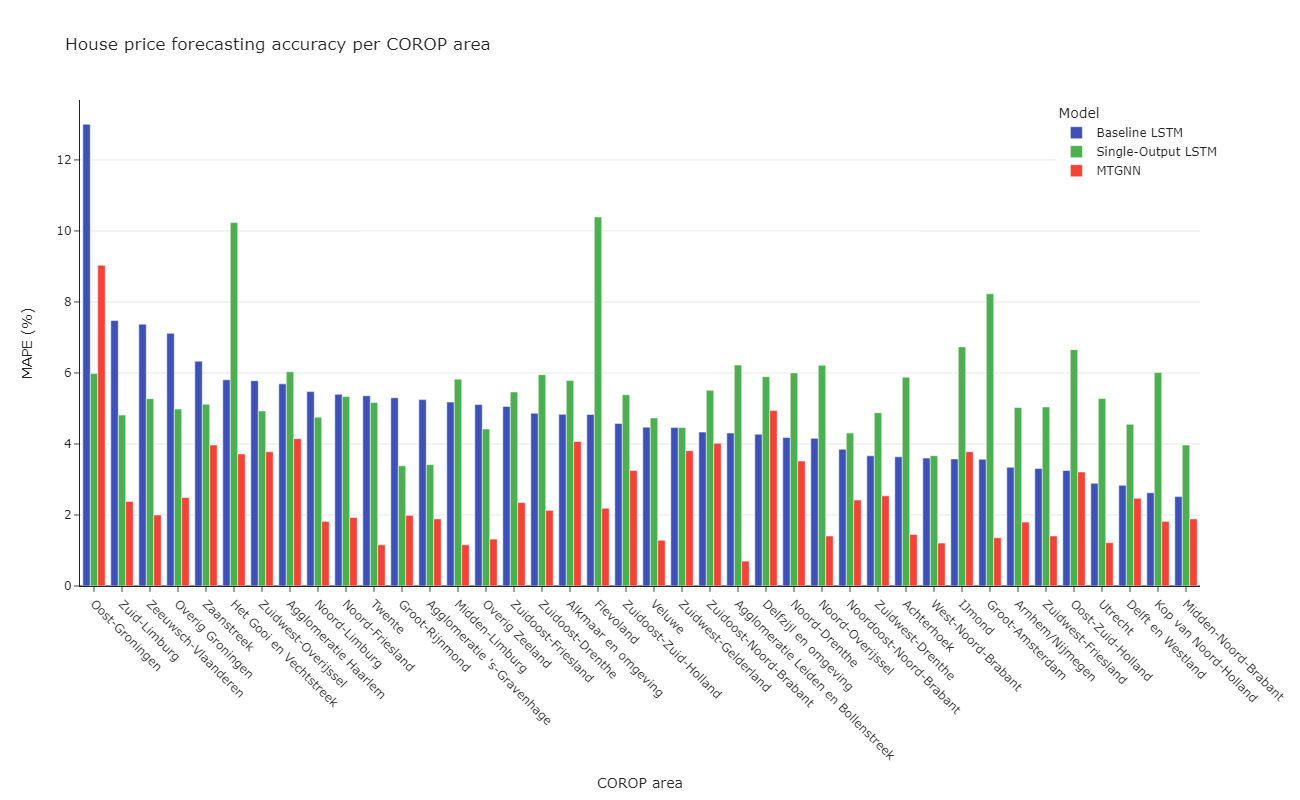
For house prices, the spatial autocorrelation test revealed moderate correlations, with the COROP areas showing higher spatial autocorrelation than provinces and municipalities. The Granger causality test indicated significant inter-area relationships, identifying many market-leading and market-lagging regions. The forecasting models showed varying performance, with the MTGNN model outperforming others with a MAPE of 2.58%, MAE of €10077, and RMSE of €11975, compared to (up to 2 times) higher error metrics for the Baseline and Single-Output LSTMs. Area-wise performance analysis revealed that the MTGNN model significantly improved forecasting accuracy in most areas, particularly for regions with higher transaction volumes, though it underperformed in some regions like Oost-Groningen.
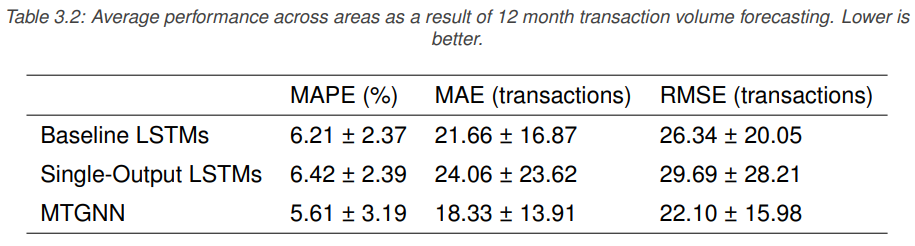
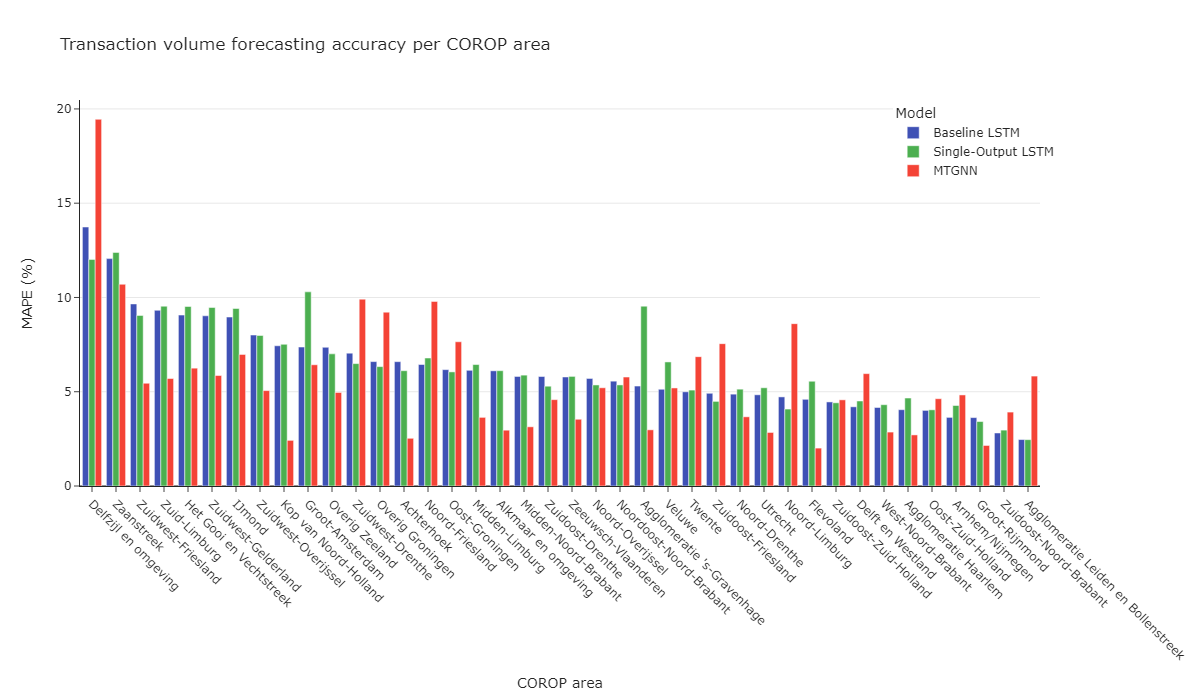
For transaction volumes, the spatial autocorrelation test showed lower and many non-significant correlations across scales. The Granger causality test identified fewer significant inter-area relationships than for house prices. Among the forecasting models, the MTGNN again performed best with a MAPE of 5.61%, MAE of 18.33 transactions, and RMSE of 22.10 transactions. Detailed area-wise analysis indicated that the MTGNN model provided notable improvements over the Baseline LSTMs in many areas, though some regions like Delfzijl en Omgeving saw less accurate forecasts.
Limitations of the results included missing data for some months on the municipal scale, limited hyperparameter tuning, and the use of a fixed random state for model runs, which might affect the generalizability of the results.
Discussion
The superior performance of the MTGNN model underscores the importance of explicitly modeling spatial relationships, which were not effectively captured by the Single-Output LSTMs. The study found that forecasting accuracy was higher in areas with more transactions, suggesting that smoother, more regular data improves model performance. While single-output models failed to significantly enhance accuracy, the multi-output MTGNN model proved effective in leveraging spatial dependencies to provide more accurate regional forecasts. This research advances previous efforts by successfully implementing a nationwide forecasting model for regional house prices and transaction volumes using the MTGNN. Future research should explore the use of higher-frequency data, lower-level forecasts, and short-term (e.g. next timestep) predictions to further refine the spatial forecasting approach. Additionally, more extensive hyperparameter optimization and the incorporation of newer GNN architectures, such as TimeGNN, could yield even better forecasting results.
Conclusion and recommendations
This research aimed to enhance housing market forecasting techniques and evaluate a nationwide spatial approach for regional predictions. The analysis confirmed spatial dependencies in the Dutch housing market, with stronger effects for house prices than transaction volumes. Granger causality tests identified different market-leading and market-lagging areas. A spatial perspective, particularly using a multi-output graph neural network (GNN) model, significantly improved forecasting accuracy over single-output Long Short-Term Memory (LSTM) models, achieving a MAPE of 2.58% (± 1.50%) for house prices and 5.61% (± 3.19%) for transaction volumes across the 40 COROP areas. The study demonstrates the feasibility of regional housing market forecasting and suggests that accuracy will further improve with more data and advanced models.